

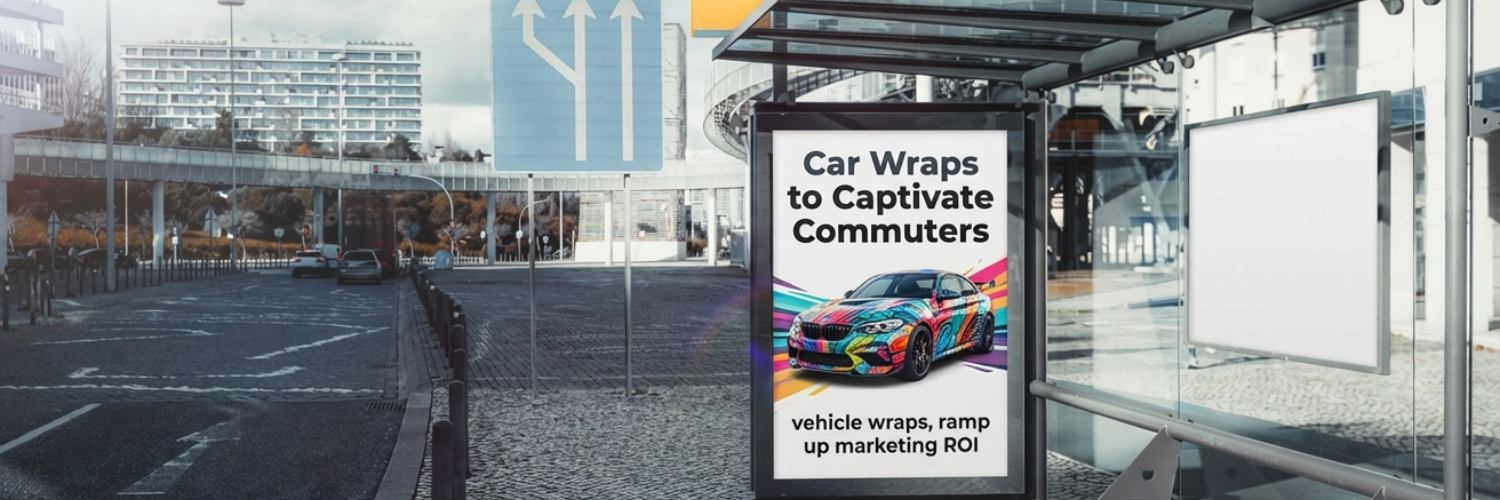
Los Angeles commuters lose 137 hours annually to traffic congestion, creating unique challenges for traditional outdoor advertising. Bus bench advertising struggles in a city where 78% of residents drive alone to work while only 6% use public transportation.
In LA’s car-dominant culture, static bench ads miss the 66 million daily vehicle trips flowing across the county’s sprawling 487 square miles. Commuters crawling along the 405, 10, and 101 freeways at 20-25 mph during rush hour represent untapped advertising potential that benches simply can’t reach.
Car wraps deliver superior results by meeting drivers where they are—on the road. Carvertise transforms ordinary vehicles into mobile billboards that generate 30,000-70,000 daily impressions while navigating the same congested corridors where your target audience spends over six full days per year.
Understanding Bus Bench Advertising in Los Angeles
Bus bench advertising places static advertisements on seating at bus stops along major corridors like Wilshire Boulevard, Sunset Boulevard, and Venice Boulevard. In Los Angeles, bench advertising typically costs $250-400 per month per location, with pricing varying based on traffic volume and neighborhood demographics.
The LA Market Reality
LA Metro recorded 311 million total boardings in 2024, averaging just over one million weekday riders. While ridership has grown 8% year-over-year, this represents only 6% of LA County commuters—the remaining 78% drive alone.
Bus benches concentrate in transit-heavy zones like Mid-City, Hollywood, and Downtown LA, completely missing car-dominant areas including the San Fernando Valley, South Bay, and Westside residential neighborhoods where professional audiences live and work.
The fundamental mismatch is stark: benches target the 311 million annual transit users while LA County’s 7.8 million registered vehicles generate 66 million trips daily. Static bench placements can’t follow commuters through their sprawling journeys across the county’s 487 square miles.
Cost-Per-Impression Analysis
A single bus bench in a moderate-traffic location generates an estimated 500-1,500 daily impressions from passing vehicles and pedestrians. At $300 monthly, that’s approximately 15,000-45,000 impressions per month—yielding a CPM of $6.67-$20.00.
Mobile advertising flips this equation entirely. A wrapped vehicle traveling LA’s congested corridors delivers 30,000-70,000 daily impressions, reaching 900,000-2.1 million monthly impressions at comparable costs—dropping the CPM to $0.14-$0.33.
Why Car-Centric Los Angeles Demands Mobile Advertising
Los Angeles Commute Behavior Data
LA County’s transportation patterns reveal a market built for mobile advertising. With 78% of workers driving alone and average one-way commutes of 31 minutes, vehicles dominate daily movement across the region. The I-405 alone handles over 370,000 vehicles daily through its busiest segments, while the I-10 sees similar volumes exceeding 345,000 vehicles.
These aren’t just numbers—they represent extended exposure opportunities. During rush hour, average freeway speeds drop to 5 mph on the 405 and 20-25 mph across major corridors, giving drivers ample time to absorb advertising messages during their crawl through traffic.
Geographic Sprawl Creates Advertising Challenges
Los Angeles County spans 4,084 square miles with 88 incorporated cities and over 140 unincorporated areas. The city of LA itself covers 469 square miles—an area larger than New York City—creating a fragmented advertising landscape where static placements can’t achieve broad coverage.
Santa Monica’s Westside commands median household incomes exceeding $90,000. San Fernando Valley’s 260 square miles house 1.82 million suburban commuters. South LA serves working-class populations, and Downtown LA mixes pedestrian traffic with vehicle commuters. A single bus bench placement reaches one micromarket; wrapped vehicles traverse all of them.
Mobile Impressions vs. Static Placements
Wrapped vehicles generate 30,000-70,000 daily impressions in typical urban environments. LA’s longer commute times mean more exposure hours, and congested traffic creates extended dwell time at eye level with fellow drivers. One wrapped vehicle covers 40-60+ miles daily across multiple neighborhoods, contrasting sharply with a bench’s permanent 20-foot radius.
During stop-and-go traffic on the 405 or 101, wrapped vehicles become unavoidable focal points. Drivers stuck in adjacent lanes have minutes, not seconds, to absorb your message—transforming LA’s notorious congestion from a frustration into an advertising advantage.
Measuring ROI Beyond Impressions: How LA Brands Track Car Wrap Performance
Traditional Outdoor Advertising’s Measurement Gap
Bus bench advertising provides estimated impression counts based on traffic volume assumptions—drivers passing a specific intersection daily multiplied by campaign duration. These estimates lack verification and offer no insight into actual business impact. Advertisers receive a monthly invoice but no data connecting ad exposure to customer behavior.
LA’s fragmented geography compounds this problem. A bench on Wilshire Boulevard might generate 1,000 daily impressions, but advertisers can’t determine if those viewers live in their service area, match their target demographic, or took any action after seeing the ad.
GPS-Verified Performance Tracking
Carvertise’s StreetMetrics partnership delivers near-real-time verification of vehicle routes, dwell times in target zones, and impression counts adjusted for weather, traffic conditions, and pedestrian density. A wrapped vehicle circulating through Beverly Hills during a rainstorm generates fewer impressions than the same route on a sunny Saturday.
Dashboard analytics break down exposure by specific LA neighborhood and time of day. Brands targeting Westside professionals see exactly how many impressions occurred in Santa Monica between 5-7 PM versus Valley suburbs during midday hours. This granularity enables mid-campaign optimization impossible with static bench placements.
Attribution and Conversion Measurement
Geofencing technology captures mobile device IDs when phones come within proximity of wrapped vehicles. Carvertise then retargets these individuals with digital ads across social media, search, and in-app channels—creating a closed loop from physical exposure to digital engagement.
Weblift Attribution quantifies website traffic increases following car wrap exposure. Brands see how many additional site visits occurred from LA County ZIP codes after campaign launch compared to control periods. This proves direct correlation between vehicle impressions and online behavior.
Custom promo codes, dedicated phone numbers, and campaign-specific landing pages provide immediate conversion tracking. A healthcare provider running wrapped vehicles near Cedars-Sinai tracks appointment bookings using a campaign phone number. A restaurant brand measures redemption rates for mobile coupons displayed on vehicle wraps.
Foot Traffic Analytics Through Placer.ai Integration
Carvertise’s partnership with Placer.ai measures physical store visits from individuals exposed to wrapped vehicles. Retailers see whether someone who passed a branded car on Monday visited their Century City location by Friday. The platform quantifies visit lift rates—comparing store traffic from exposed audiences versus unexposed control groups.
This matters in LA’s sprawling market where customers might encounter a wrapped vehicle in Downtown LA but visit a store location in Pasadena three days later. Traditional outdoor advertising can’t connect these dots. Mobile impression data linked to actual foot traffic provides ROI clarity that justifies continued investment.
Real Performance: Visit Indy Reaches Chicago Market with 33-Vehicle Fleet
Campaign Overview
Visit Indy needed to stand out among competing travel destinations targeting Chicago residents following pandemic travel restrictions. Traditional advertising struggled to cut through the clutter in Chicago’s saturated media market. The bureau required a memorable campaign that would reach Chicagoans with discretionary income—Visit Indy’s primary leisure travel market.
Carvertise deployed 33 branded Uber and Lyft vehicles throughout Chicago for a multi-month campaign. The fleet number matched the 33 cars competing in the Indianapolis 500, creating a thematic connection. Wrapped vehicles circulated through Chicago’s high-traffic areas, targeting the city’s 2.7 million residents with Visit Indy branding.
Results and Performance Metrics
In the first 30 days alone, the 33-vehicle fleet drove over 63,000 miles and generated 9 million impressions across Chicago. GPS tracking verified routes covered target areas throughout the city, with some Chicago residents booking rides in Visit Indy branded vehicles during their daily travels.
Digital retargeting amplified campaign reach—individuals who saw the wrapped vehicles received Visit Indy ads on their mobile devices, creating multiple touchpoints across physical and digital channels. This integrated approach maximized exposure beyond initial vehicle impressions.
Key Success Factors
Strategic vehicle count created brand presence without oversaturation. The 33-car fleet maintained consistent visibility across Chicago without overwhelming the market. Geographic targeting focused on areas with high concentrations of potential leisure travelers rather than blanket citywide coverage.
Thematic connection to the Indianapolis 500 strengthened brand messaging and created conversation opportunities. Campaign timing coincided with travel industry reopening, positioning Indianapolis as an accessible destination for Chicago residents seeking nearby travel options during recovery periods.
Getting Started with Car Wrap Advertising in Los Angeles
Planning Your LA Campaign
Start with 3-5 vehicles minimum to establish meaningful market presence. One or two wrapped cars blend into LA’s visual noise; a small fleet creates pattern recognition as commuters encounter your brand across multiple routes and days. Define target audiences by neighborhood—map where your customers live, work, and commute rather than demographic abstractions.
Creative design requires legibility at 40+ mph on LA freeways. Bold colors, minimal text (10 words maximum), and high-contrast imagery ensure drivers absorb your message during brief exposure windows. Include trackable elements: QR codes, promo codes, or vanity URLs that attribute conversions to vehicle impressions.
Campaign timing matters in LA’s seasonal patterns. Tourist season (June-August) maximizes exposure on routes to beaches and attractions. Event-based timing around Dodgers playoffs, Lakers games, or concerts amplifies reach when target audiences concentrate in specific corridors.
Getting Started with Car Wrap Advertising in Los Angeles
Launch your LA campaign with 3-5 vehicles minimum to establish market presence. Creative design requires legibility at 40+ mph: bold colors, minimal text, high-contrast imagery. Consider seasonal timing around tourist season or event-based activations during Dodgers playoffs and Lakers games when target audiences concentrate in specific corridors.
Carvertise’s campaign setup takes 2-4 weeks from creative approval through deployment. The dashboard provides real-time GPS tracking, impression counts by neighborhood, and route visualization. Mid-campaign optimization adjusts vehicle deployment based on performance data.
Ready to reach LA’s car-dominant market? Contact Carvertise to deploy mobile advertising across LA County’s 4,084 square miles—delivering verified impressions and measurable business impact that bus benches cannot match.
Frequently Asked Questions
What’s the minimum campaign size for LA County?
Start with 3-5 vehicles to establish a meaningful presence across LA’s 4,084 square miles. Smaller deployments blend into visual noise; a fleet creates pattern recognition as commuters encounter your brand across multiple routes and days.
How quickly can campaigns launch in Los Angeles?
Campaign setup takes 2-4 weeks from creative approval through vehicle wrapping and deployment. Carvertise coordinates with LA-based drivers, schedules installations, and begins GPS tracking as wrapped vehicles enter target neighborhoods.
Can I target specific LA neighborhoods or demographics?
Yes. Deploy vehicles in precise zones—Beverly Hills and Santa Monica for luxury brands, medical districts near Cedars-Sinai for healthcare, Hollywood and Burbank corridors for entertainment companies. Driver selection matches existing commute patterns to reach target demographics naturally.
How is campaign performance measured?
GPS tracking verifies routes, dwell times, and impressions adjusted for traffic and weather conditions. Geofencing captures mobile device IDs for digital retargeting. Weblift Attribution measures website traffic increases from LA County ZIP codes. Placer.ai integration tracks physical store visits from exposed audiences.
What makes car wraps more effective than benches during LA traffic?
LA’s average rush hour speed of 20-25 mph creates extended exposure time. During stop-and-go traffic on the 405 or 101, drivers have minutes to absorb eye-level messaging. Wrapped vehicles offer 360-degree visibility versus single-view benches drivers pass in seconds.