

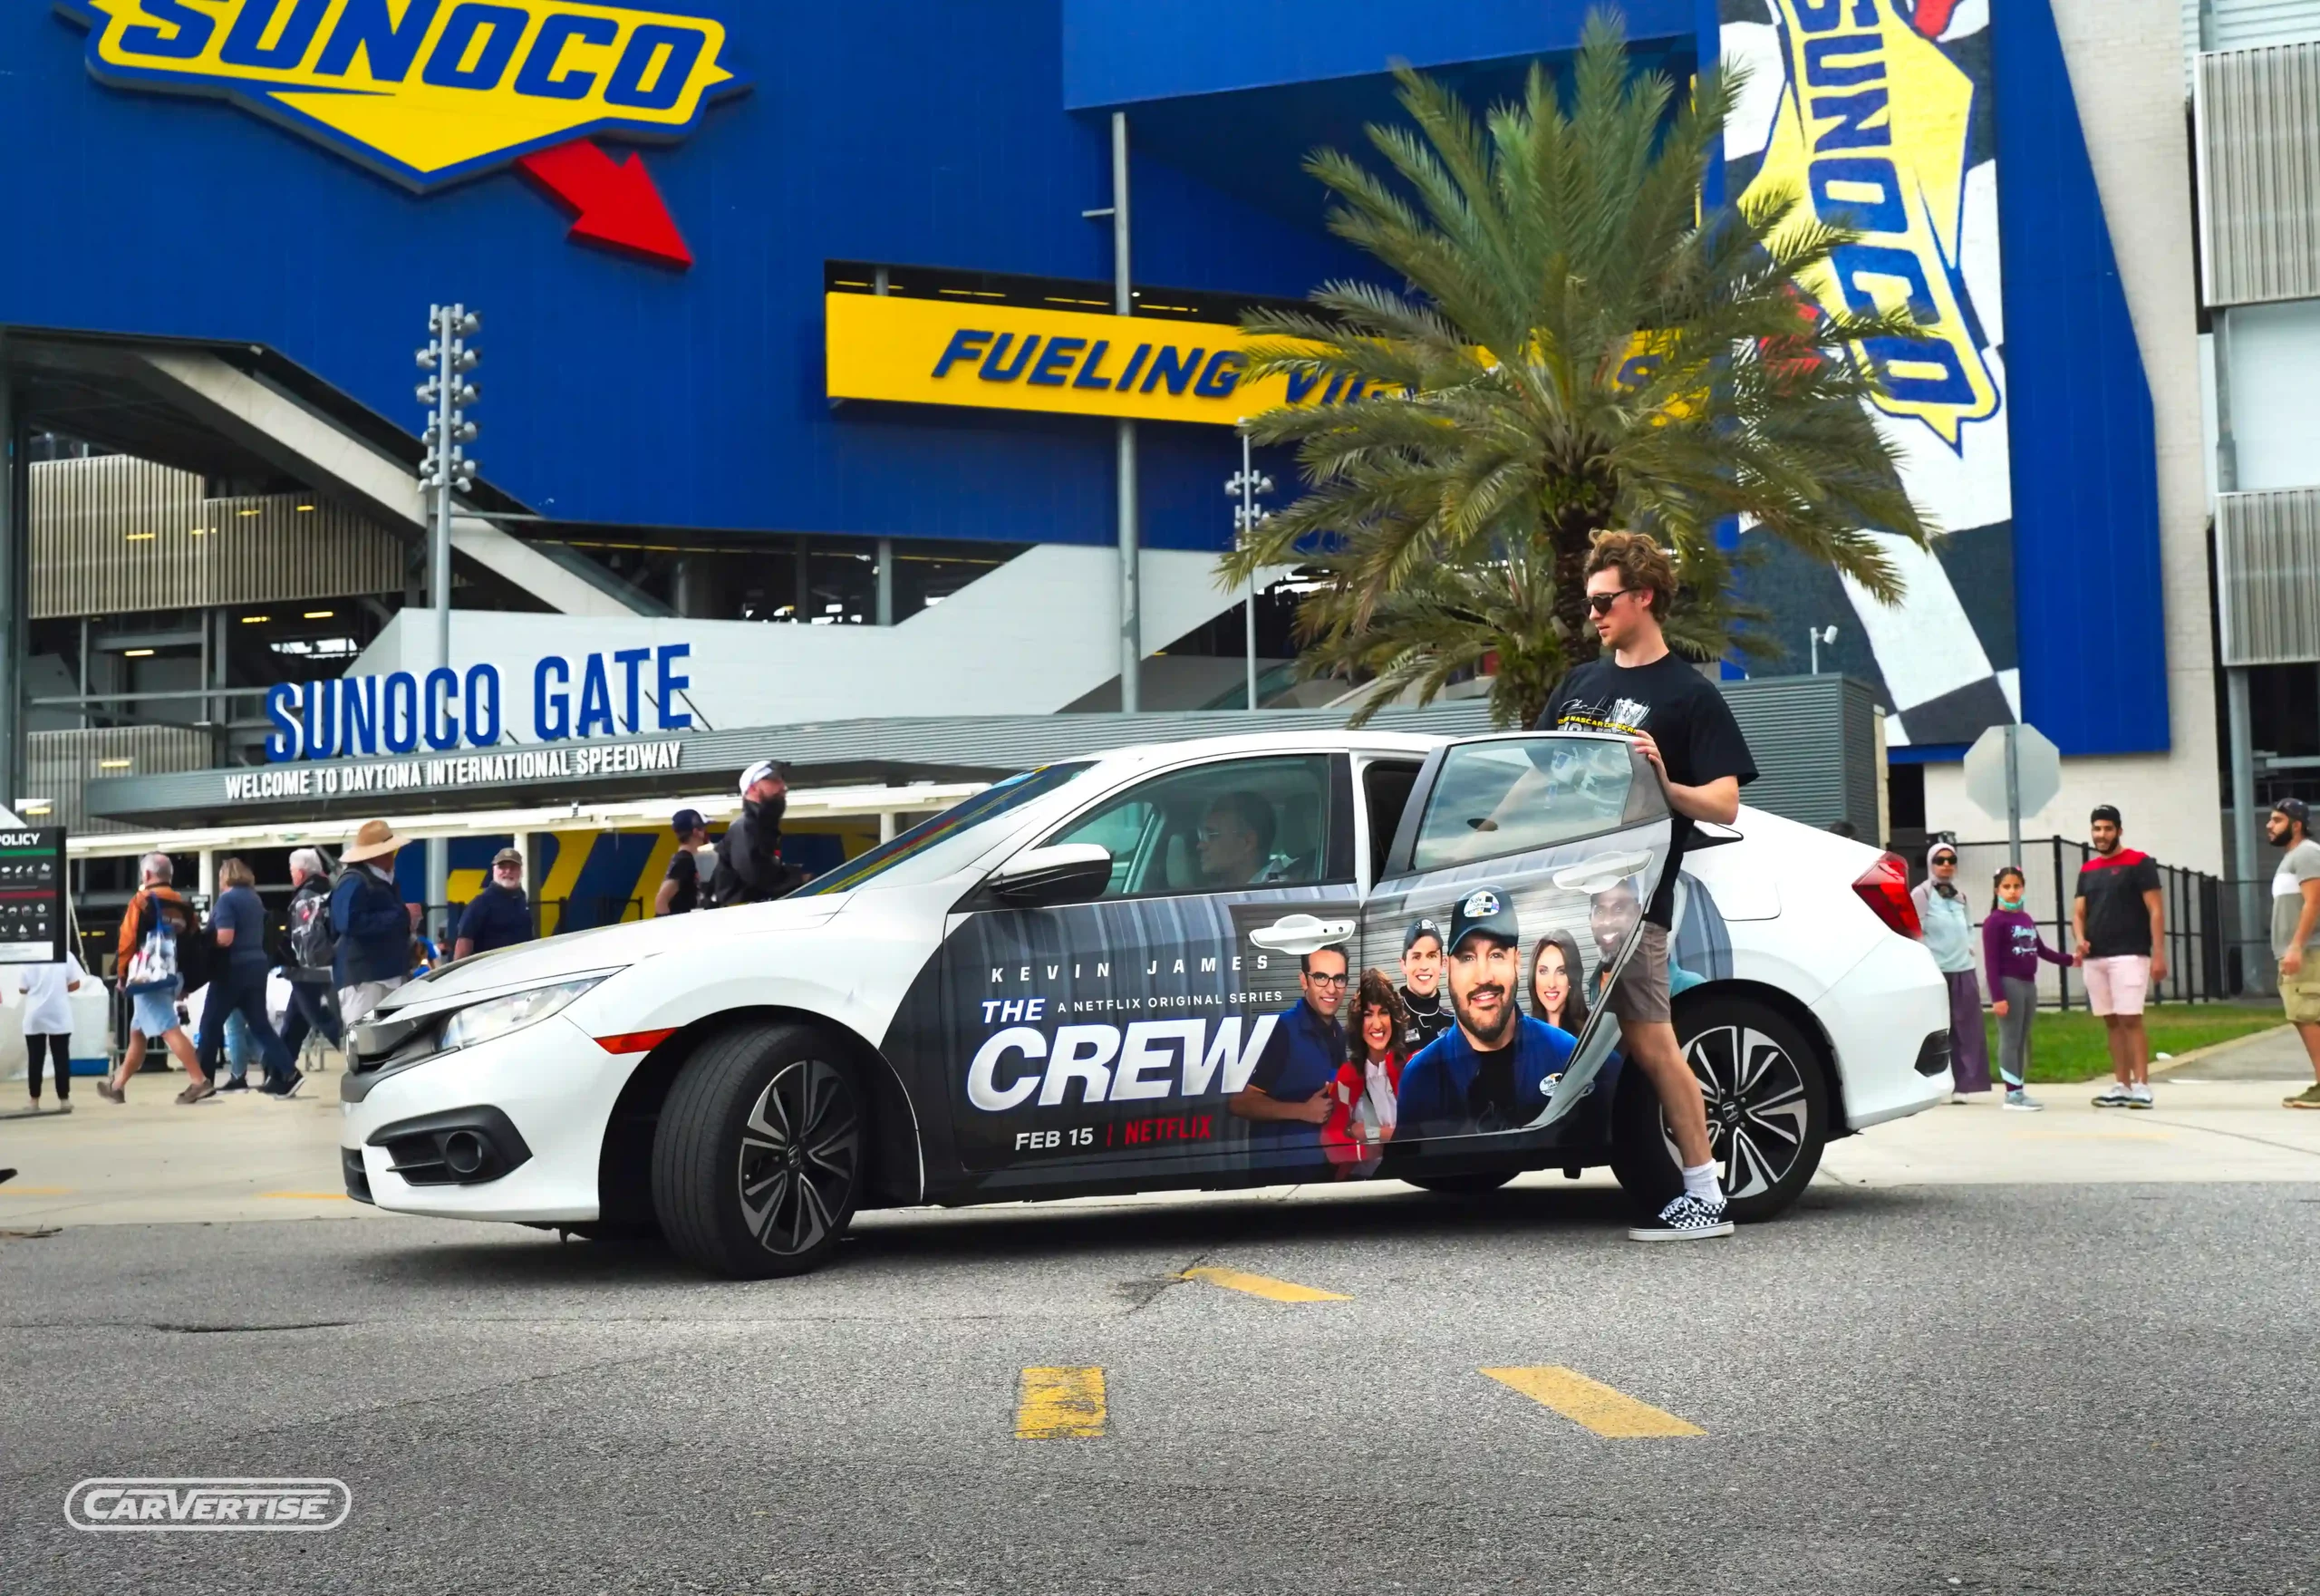
Trade shows and conferences remain one of the most valuable opportunities for B2B brands to engage decision-makers. But while marketers continue investing heavily in sponsorships, booths, branded activations, and experiential campaigns, many struggle to answer one question after the event:
Did our conference takeover actually work?
In 2026, measuring conference brand visibility requires much more than counting booth visitors or badge scans. Modern marketers can now track campaign exposure before attendees arrive, during the event, and after everyone returns home using GPS-verified mobility data, impression modeling, geographic attribution, and digital engagement metrics.
This guide explains how marketers should measure conference takeover performance, what KPIs matter most, and how mobile advertising campaigns can provide measurable visibility throughout the entire conference lifecycle.
Why Conference Measurement Has Changed
Conference marketing has evolved.
Instead of measuring only what happens inside the convention center, brands now influence attendees throughout their entire journey:
- Before arriving
- Traveling around the city
- Visiting networking events
- Going to hotels and restaurants
- Returning home
A successful conference campaign creates repeated exposure across every stage—not just inside the exhibit hall.
That makes comprehensive measurement essential.
What Is Conference Brand Visibility?
Conference brand visibility measures how frequently your target audience encounters your brand before, during, and after an event.
Visibility includes:
- Mobile advertising impressions
- Vehicle-based advertising exposure
- Booth interactions
- Digital engagement
- Social media amplification
- Geographic reach
- Brand recall
- Website traffic increases
- Lead generation
The strongest campaigns combine multiple touchpoints into one measurable reporting framework.
The Three Phases of Conference Measurement
1. Pre-Event Visibility
Brand awareness starts well before attendees walk into the venue.
Successful marketers begin creating visibility several days or even weeks before the conference.
Typical pre-event metrics include:
- Geographic market coverage
- Estimated impressions
- Website traffic from event markets
- Social engagement
- Branded search increases
- Email engagement
- Local audience reach
Mobile billboards and rideshare advertising are particularly effective because they repeatedly reach attendees traveling through airports, hotels, entertainment districts, and surrounding business centers.
2. In-Market Performance
This is where many conference campaigns are won—or lost.
Instead of relying only on booth traffic, marketers should evaluate citywide visibility.
Important metrics include:
GPS-Verified Routes
GPS tracking confirms where branded vehicles traveled throughout the campaign.
This validates:
- Route completion
- Venue proximity
- High-traffic areas covered
- Hotel districts reached
- Entertainment corridors served
Impression Delivery
Modern impression modeling estimates how many people likely viewed campaign assets based on:
- Traffic volume
- Route frequency
- Population density
- Time of day
- Event attendance
Rather than guessing visibility, marketers receive quantified exposure estimates.
Frequency
Brand recall improves through repeated exposure.
Measure:
- Average exposures per attendee
- Daily campaign frequency
- Route repetition
- High-value audience concentration
Repeated impressions often outperform one-time advertising.
Geographic Penetration
Not every attendee spends all day inside the convention center.
Campaign reporting should demonstrate visibility across:
- Convention centers
- Hotels
- Airport corridors
- Downtown business districts
- Networking venues
- Restaurants
- Entertainment zones
This creates a more accurate picture of audience reach.
3. Post-Conference Attribution
The campaign shouldn’t stop when the conference ends.
Post-event analysis reveals whether awareness translated into business outcomes.
Track:
- Website traffic increases
- Demo requests
- QR code scans
- Landing page visits
- Sales conversations
- Pipeline creation
- Marketing-qualified leads
- CRM attribution
These metrics help connect conference visibility with actual revenue opportunities.
Key KPIs Every Conference Campaign Should Measure
| KPI | Why It Matters |
|---|---|
| Brand impressions | Measures campaign reach |
| GPS verification | Confirms campaign execution |
| Geographic coverage | Demonstrates market penetration |
| Audience frequency | Improves brand recall |
| Website traffic | Indicates increased interest |
| QR code scans | Tracks direct engagement |
| Lead generation | Measures demand creation |
| Brand search lift | Signals awareness growth |
| Social mentions | Reflects audience engagement |
| Pipeline influenced | Connects visibility to revenue |
Measuring Sponsor Visibility Beyond the Booth
One of the biggest limitations of sponsorship reporting is that it typically measures only activity inside the event.
Yet attendees spend much of their time:
- Traveling between hotels and the venue
- Dining with colleagues
- Visiting networking events
- Exploring the host city
- Commuting from airports
Brands that extend visibility into these environments often generate significantly more exposure than booth-only campaigns.
This is why sponsor visibility should be evaluated across the entire attendee journey—not just exhibit hall interactions.
How Mobile Advertising Improves Conference Measurement
Mobile advertising introduces measurable assets that traditional sponsorships often lack.
These include:
- GPS route verification
- Daily campaign reporting
- Impression estimates
- Geographic coverage maps
- Route optimization
- Market penetration reporting
- Campaign photography
- Real-time campaign monitoring
Instead of relying on attendance estimates alone, marketers receive tangible campaign data.
Connecting Brand Awareness to Marketing ROI
Marketing leaders increasingly need evidence that awareness campaigns contribute to business outcomes.
Conference measurement should connect visibility with downstream performance such as:
- Increased branded search
- Website engagement
- Higher direct traffic
- CRM activity
- Sales meetings
- Opportunity creation
- Pipeline influenced
- Closed revenue
When these indicators are tracked together, conference campaigns become easier to evaluate and optimize.
Common Conference Measurement Mistakes
Avoid these frequent reporting errors:
Measuring only booth traffic
Booth visits represent only one portion of attendee engagement.
Ignoring pre-event awareness
Many attendees decide which vendors to visit before arriving.
No geographic reporting
Without location data, marketers cannot verify market coverage.
Focusing only on impressions
Reach matters—but frequency and attribution matter even more.
Ending measurement after the conference
The most valuable conversions often happen days or weeks after the event.
Building a Better Conference Reporting Dashboard
An effective reporting dashboard should combine:
- Campaign dates
- GPS verification
- Geographic heat maps
- Impression estimates
- Frequency metrics
- Website analytics
- QR performance
- Lead generation
- CRM attribution
- Pipeline reporting
Combining these metrics creates a complete view of conference performance rather than isolated data points.
Frequently Asked Questions
What is conference brand visibility?
Conference brand visibility measures how often attendees encounter your brand before, during, and after an event through advertising, sponsorships, experiential activations, and digital engagement.
How do marketers measure conference marketing ROI?
Conference marketing ROI is measured using impression data, GPS verification, website traffic, lead generation, CRM attribution, pipeline influence, and revenue generated from conference-related opportunities.
Why is GPS tracking important for conference advertising?
GPS tracking verifies that branded vehicles traveled the planned routes, covered target locations, and delivered the campaign as intended, providing accountability and measurable execution.
What metrics matter most for sponsor visibility?
The most important metrics include impressions, audience frequency, geographic coverage, website traffic, QR code engagement, branded search lift, and lead generation.
Can brand awareness campaigns be measured?
Yes. While awareness is not always tied to immediate conversions, marketers can measure it through impression estimates, search volume increases, direct traffic, social engagement, recall studies, and downstream sales activity.
Final Thoughts
Conference success is no longer measured solely by booth traffic or badge scans. The most effective B2B marketers evaluate conference brand visibility across the entire attendee journey—from pre-event awareness and in-market exposure to post-event attribution and pipeline impact.
By combining GPS-verified tracking, impression modeling, geographic coverage, engagement analytics, and CRM reporting, brands gain a complete picture of how their conference investments perform. This data-driven approach not only improves marketing ROI but also helps optimize future event marketing and experiential marketing campaigns with confidence.
Ready to Measure Your Next Conference Takeover?
Carvertise helps brands extend conference visibility beyond the convention center with GPS-verified mobile advertising campaigns, comprehensive reporting, and measurable attribution. Contact Carvertise today to learn how your next conference campaign can deliver citywide brand awareness with results you can prove.